Introduction
Incarceration rates in the United States increased drastically over the 20 th century and into the early 21 st century. Rates peaked in the year 2009 at a rate of roughly 500 residents per 100,000, with a total prison population of around 1.6 million (Bureau of Justice Statistics, 2020). Since 2009, however, rates have been declining. As of 2019, incarceration rates are the lowest they have been since 1996, and the combined federal and state incarceration rate in the U.S. is just over 400 residents per 100,000, which is a 17% decrease from what it was in 2009. According to the Bureau of Justice Statistics (2020), there were 1.4 million prison inmates at year-end 2019, which is around a 12% decrease from the 2009 totals.
Regardless of these declines, the U.S. still incarcerates more individuals than any other country in the world, with estimates suggesting that the total incarcerated population in the U.S. exceeds 2 million (Prison Policy, 2018; Prison Studies, n.d.). China follows in second place with roughly 1.7 million incarcerated people, and Brazil is third with around 760,000 (Prison Studies, n.d.). The direct cost of managing and operating such a large prison system in the U.S. has been estimated to exceed $80 billion a year, though some researchers argue this number is underestimated (Kearney, Harris, Jácome, and Parker, 2014). Studies that incorporate indirect costs into their calculations, like lost earnings and adverse health effects, find the overall cost to exceed $1.2 trillion (Pettus-Davis, Brown, Veeh, and Renn, 2016). In addition to requiring substantial resources to manage and operate, researchers have noted the significant effects and costs of incarceration on the incarcerated and their families (Parke and Clarke-Stewart, 2002; Gifford, 2019).
Considering the high rates of incarceration in the U.S., and their effect on individuals and families, important effects will likely manifest at the community level too. Moreover, other community-level factors, like economic conditions, may impact local incarceration rates. This suggests that empirical investigations into community-level incarceration rates and how they are impacted by other community-level factors will be informative. Identifying these factors could inform policies aimed at decreasing incarceration rates. Undoubtedly, effective policies will involve some components aimed at curbing incarcerable behaviors and reducing likelihoods of committing criminal offenses (Ratcliffe, 2005). This further suggests that the relevant set of community-level factors to investigate will include those linked to childhood and adolescent experiences, which have significant effects on outcomes and behaviors in adulthood (Chetty, Hendren, and Katz, 2016; Chetty, Friedman, Hilger, Saez, Schanzenbach, and Yagan, 2011; Chetty, Hendren, Lin, Majerovitz, and Scuderi, 2016; Gibb, Fergusson, and Horwood, 2012; Heckman, 2008). Bearing these facts in mind, a critical factor to consider is local elementary education systems, which involve the first level of primary education received, and how they relate to local incarceration rates.
For this study, we are interested in analyzing how elementary education systems, specifically characteristics of these systems that are associated with student outcomes and educational experiences at the district level, are related to incarceration rates in the underlying census tracts in the state of North Carolina. The two elementary education-related characteristics we examine are test scores and student-teacher ratios, both of which are linked to student outcomes and experiences (Chetty, Hendren, Kline, and Saez, 2014; Hanushek, 2003). This study has four primary research questions which we examine empirically. First, are test scores directly related to local incarceration rates? Second, are student-teacher ratios directly related to local incarceration rates? Third, are test scores indirectly related to local incarceration rates, mediated through other local factors? Fourth, are student-teacher ratios indirectly related to local incarceration rates, mediated through other local factors? We use a structural equation model to estimate the direct effects of test scores and student-teacher ratios on incarceration rates, while also estimating the indirect effects of both on incarceration rates, mediated through other important local factors like employment outcomes, crime, and poverty, just to name a few. Our results suggest that both test scores and student-teacher ratios have significant negative direct effects on incarceration rates. Moreover, test scores have a significant indirect effect on incarceration rates through a subset of the mediating factors.
Our paper is structured as follows. First, we review the relevant background and literature. Second, we summarize our methods, which are motivated by the study’s theoretical framework. Third, we present the results of our analysis. Fourth, we offer a discussion of the results, followed by a conclusion.
Background and literature review
Direct Relationship Between Education Systems and Incarceration
Numerous studies show that when children perform better in school, learn more, and have better experiences in the education system, the long-term benefits are substantial. When children receive better educations and attend high quality schools, they are likely to be more confident in themselves, have greater aspirations for their futures, less likely to have disciplinary issues, less likely to drop out, and are more likely to later attend college (Baumeister, Campbell, Krueger, and Vohs, 2003; Muenks, Wigfield, and Eccles, 2018; Giraldo, Ojha, and Ojha, 2017). Moreover, research demonstrates that attending a high-quality school and receiving a higher quality education can substantially improve children’s socioeconomic outcomes. For example, these children can expect higher lifetime earnings, greater long-term education attainment, and even lower incarceration rates (Chetty et al., 2011; Card and Krueger, 1992; Giraldo et al., 2017; Lochner and Moretti, 2004; Arum and LaFree, 2008; Arum and Beattie, 1999). Hence, communities that have better schools are likely to have lower incarceration rates because of the beneficial effects of participating in a higher quality education system.
It is important to underscore the extensive research into the punitive disciplinary policies that many schools in the U.S. have adopted (Owens, 2017; Ray, 2013). Schools have adopted punitive and zero-tolerance policies towards student behavior, which have tended to involve law enforcement in the disciplining of students (Owens, 2017; Ray, 2013). Evidence suggests that worse-performing schools tend to have higher rates of disciplinary issues, suspensions, expulsions, and student-arrests (Figlio, Karbownik, Roth, and Wasserman, 2016). Moreover, struggling schools tend to be in low-income and disadvantaged communities (Owens, Reardon, and Jencks, 2016; Owens and Candipan, 2019). Hence, communities with struggling schools will likely have higher percentages of their students encountering the criminal justice system, which likely further promotes incarceration rates.
Indirect Relationship Between Education Systems and Incarceration
A particular challenge when investigating the relationship between elementary education systems and incarceration rates at a community level is that numerous other factors are certainly at play in influencing both education and incarceration rates. Communities have numerous and varying degrees of inputs that affect the outputs and outcomes associated with a community. Moreover, the inputs are likely related to one another. Research suggests that, in the context of an analysis of elementary education systems and incarceration rates, there are many other factors to consider, such as crime rates, employment outcomes, social capital, education attainment, poverty, and so on, which are related to characteristics associated with elementary education system quality, like test scores and student-teacher ratios, and incarceration rates in a community level (Ludwig, Duncan, and Hirschfield, 2001; Kelly, 2000; Kingston and Webster, 2015; DeFina and Hannon, 2013; Rosenfeld and Fornango, 2007; Lauritsen, Rezey, and Heimer, 2014; Raphael, Winter-Ebmer, 2001). There have been very few studies, however, that have examined this relationship at the community level while also explicitly addressing the interrelatedness of a community’s diverse set of important and relevant socioeconomic, economic, and demographic characteristics.
Socioeconomic Factors
Linking Education to Incarceration, through Poverty
A key factor by which elementary education systems may indirectly impact community-level incarceration rates is poverty. Research finds that effective education systems, especially elementary education systems, can increase expected lifetime earnings and promote upward economic mobility. Chetty, Firedman, Hilger, Saez, Schanzenbach, and Yagan (2011) find that students randomly assigned to higher quality classrooms in grades Kindergarten through third grade earn more as adults and are also more likely to become homeowners later in life. Moreover, Chetty et al. (2014) find that one of the strongest positive correlates with upward economic mobility rates is the quality of elementary schools in the local system. The relationship between poverty and incarceration is well documented. Communities with high poverty rates tend to have higher crime and incarceration rates (Ludwig et al., 2001; Kelly, 2000; Kingston and Webster, 2015; DeFina, and Hannon, 2013). Hence, elementary education systems may indirectly affect community-level incarceration rates through their impact on poverty.
Linking Education to Incarceration, through Crime
A factor by which elementary education systems may indirectly impact community-level incarceration rates is crime. Evidence suggests that students who attend high-quality schools are significantly less likely to commit crimes, especially violent crimes (Giraldo et al., 2017). Furthermore, the relationship between crime and incarceration is well established, in that higher crime rates tend to be positively related to higher incarceration rates (McGuire and Sheehan, 1983; Marvell and Moody, 1994). Hence, elementary education systems may indirectly affect community-level incarceration rates through their impact on local crime.
Linking Education to Incarceration, through Social Capital
Elementary education systems may indirectly affect community-level incarceration rates through their impact on social capital. According to Glaeser, Laibson, Scheinkman, and Soutter (1999), years of schooling is the most robust corelate to social capital. Children, especially at-risk youth, that have better experiences in school tend to build better relationships, which promote social capital accumulation (Muller, 2001). Moreover, both empirical and theoretical evidence suggests that social capital and incarceration rates are negatively related. High levels of social capital in the forms of strong friend and family networks may act as alternate forms of social control, reducing crime and incarceration, though the relationship is complex (Rose and Clear, 1998; Sampson, and Groves, 1989). For instance, using a state-level longitudinal dataset, Hawes (2017) finds that social capital is positively related to incarceration rates, but only for African Americans. Hence, elementary education systems may indirectly impact community-level incarceration rates through social capital.
Linking Education to Incarceration, through Income Inequality
Income inequality is a factor through which elementary education systems may affect community-level incarceration rates. In their 1998 paper, Arvanites, Thomas and Asher find that income inequality is a significant predictor of incarceration rates at the state level. Furthermore, Greenberg (1977) analyzed country-level data and found that economic inequality and rates of imprisonment are strongly and positively related. Though not as clear, evidence suggests that the quality of local elementary education systems is related to income inequality. For instance, wealthier parents are more likely to move near better schools, which further exacerbates income inequality because their children receive higher quality educations and enjoy the corresponding economic returns, while low-income children are left behind (Glomm and Ravikumar, 2003). Hence, elementary education systems may indirectly affect community-level incarceration rates through income inequality.
Linking Education to Incarceration, through Racial Segregation
Elementary education systems may indirectly impact community-level incarceration rates through racial segregation. An abundance of evidence suggests that characteristics associated with school quality and racial segregation are strongly related. Racially segregated areas, especially segregated areas involving non-white minorities, tend to have significantly worse performing schools (Logan, Minca, and Adar, 2012). Moreover, racially segregated areas, especially those with high concentrations of African Americans, tend to experience higher incarceration rates even after controlling for crime and arrest rates (Simes, 2018). Therefore, community-level incarceration rates may be impacted by local education systems mediated through their effect on racial segregation.
Linking Education to Incarceration, through Risk of Mortality
A factor by which elementary education systems may indirectly impact community-level incarceration rates is risk of mortality. There are a wide variety of health-related benefits, including decreased risk of mortality, associated with both quality and quantity of education (Cohen and Syme, 2013). Moreover, public health problems, like mortality risk, and incarceration are related (Wildeman, 2016; Daza, Palloni, and Jones, 2020). Hence, a factor by which elementary education systems may indirectly affect community-level incarceration rates is mortality risk.
Demographic Factors
Linking Education to Incarceration, through Population Education Attainment
Elementary education systems may indirectly impact community-level incarceration rates through the factor of adult education attainment. High-quality primary schools may attract highly educated parents to the district (Glomm and Ravikumar, 2003). Also, children who attend high-quality schools are more likely to pursue higher education themselves (Chetty et al., 2016). Moreover, studies have demonstrated a causal link between education attainment and crime and incarceration. In their 2015 study using data from Sweden's Multigenerational Register, Hjalmarsson, Holmlund, and Lindquist (2015) estimate that one additional year of schooling for males decreases the likelihood of incarceration by 15.5%. Thus, elementary education systems may indirectly affect community-level incarceration rates through adult education attainment.
Linking Education to Incarceration, through Family Stability
Community-level incarceration rates may be affected by elementary education systems through the factor of family stability. The link between elementary education systems and family stability is more tentative, though there is secondary evidence suggesting that the two are positively related. Attending better schools and receiving higher quality educations does lead to fewer teenage pregnancies and risky sexual behaviors, which may promote stable family environments (Copping, Campbell, and Muncer, 2013; Laflin, Wang, and Barry, 2008). Early exposure to a high-quality education may promote the likelihood of successful marriages, though the direction between the two variables is far from clear. That there is a relationship between family stability and incarceration finds significantly more support in the literature. Research demonstrates that being raised in single-parent households increases the likelihood of committing crimes, being arrested, and becoming incarcerated, though the relationship is multifaceted (Anderson, 2002; Schwartz, 2006; Antecol and Bedard, 2007). Hence, a factor by which elementary education systems may indirectly affect community-level incarceration rates is through its impact on family stability.
Economic Factors
Linking Education to Incarceration, through Employment Opportunities
Elementary education systems may indirectly impact community-level incarceration rates mediated through employment opportunities. Children that attend higher quality elementary schools tend to earn higher wages and have lower unemployment rates as adults (Chetty, et al., 2011). Moreover, the link between economic conditions and crime and incarceration is well supported (Rosenfeld, and Fornango, 2007; Lauritsen et al., 2014; Raphael, Winter-Ebmer, 2001). Thus, a factor by which elementary education systems may indirectly affect community-level incarceration rates is through employment outcomes.
Linking Education to Incarceration, through Homeownership
Elementary education systems may impact community-level incarceration rates through their impact on homeownership. In their 2011 paper, Chetty et al. demonstrate that elementary school children randomly assigned to better classrooms are more likely to become homeowners as adults, which can promote wealth accumulation especially among low-to-moderate income residents (Grinstein-Weiss, Key, Guo, Yeo, and Holub, 2013). Moreover, areas with higher homeownership rates can promote neighborhood stability and social cohesion, which can reduce crime and incarceration (Rohe, and Stewart, 1996; Thomas, Torrone, and Browning, 2010). Living in an owned home significantly benefits low-income children, who are less likely to drop out of school and less likely to ever be arrested (Green and White, 1997). Therefore, a factor by which elementary education systems may indirectly effect community-level incarceration rates is through homeownership.
Method
Theoretical Framework and ModelCommunities are highly complex, with numerous inputs and outputs which are interrelated. Therefore, the theoretical framework underlying our study is based on systems theory. Arnold and Wade (2015, p.7) define a system as "groups or combinations of interrelated, interdependent, or interacting elements forming collective entities." Communities are social organizations that define their boundaries through either geographic definitions of community or an ethnic boundary definition, as in ethnic communities. The community can be seen as an organizational system where various parts operate to create a cycle of events. Draft (2010) notes the cycle of events, includes inputs, processes, outputs, feedback, and the environment. Viewing the community from a systems perspective allows researchers to understand how the process and interrelated components impact individual units. The community is an open and living system that consists of a continuous cycle of events between people and other institutions within the system (Hossein et al., 2011). Bartallanffy (1972) noted that to understand an organization and the roles each part of it plays, one must assess the various patterns of these relationships.
General systems theory distinguishes the microsystems, mezzosystems, and macrosystems by size and capacity (Von Bertalanffy, 1950). Microsystems are defined as small-size social systems, such as individuals and couples. The mezzosystems are defined as intermediate-size systems, such as support networks, groups, and extended families. Macrosystems are defined as larger systems, such as communities and organizations. In our study, we are interested in how the macrosystem-related variables (community; educational institutions) and mezzosystem-related variables (family; employers; detention centers) are related to incarceration rates of individuals in the local area (microsystem-related). Ultimately, we estimate this complex network of interrelated factors, with the primary outcome variable being local incarceration rates.
Based on the relevant literature, and motivated by our theoretical framework, we propose the following simplified theoretical model to motivate our empirical analysis (see Figure 1). The theoretical model shows that characteristics related to local elementary schools, especially those associated with schools’ effectiveness at educating students, are directly and indirectly related to a community’s incarceration rates. Local elementary school characteristics are theorized to indirectly affect local incarceration rates mediated through other key community characteristics linked to socioeconomics, economics, and demographics. Hence, elementary school characteristics have an impact on a community’s socioeconomic, economic, and demographic characteristics, which in turn have their own impact on local incarceration rates. Given the complexity and interrelated nature of these relationships, our theoretical model includes the possibility that the relationship from elementary school characteristics to the factors of socio-economic, economic, and demographic are bi-directional. Meaning that neighborhood characteristics related to these three dimensions also have their own impacts on elementary school characteristics.
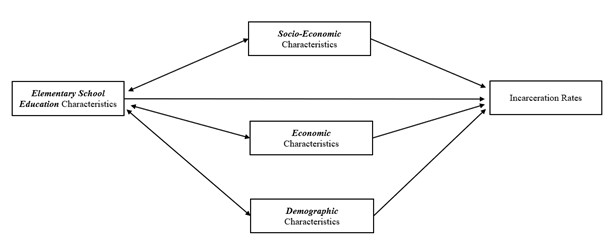
Figure 1. Theoretical Model
Empirical Method and Hypothesized Model
Characteristics associated with a school's effectiveness at educating students (school quality), like test scores and student teacher ratios, have an impact on many variables, which themselves impact other variables. When an outcome variable, like incarceration rates, is related to both school quality and variables that school quality affects, then this suggests the presence of a system of relationships. To estimate such a system, a structural equation model (SEM) path analysis approach is an effective way of doing so. Path analysis applies an SEM, but without latent variables. Within an SEM, each endogenous variable has an equation consisting of other variables in the system. Plausible causal pathways exist between the variables in the system. Some variables may have a direct pathway to the outcome variable, while some variables may only have an indirect pathway to the outcome variable mediated through another factor. These equations are solved, one corresponding to the outcome variable and each endogenous variable, by fitting the data using maximum likelihood estimation (Miller et al., 2020). The results of this process reveal the strength, direction, and significance of the tested direct effects. Using these direct effects, the tested indirect effects can then be calculated. An SEM approach, therefore, has an advantage over linear regression models, which do not test for indirect pathways between variables.
We use SEM to estimate both direct and indirect effects of elementary school test scores and student-teacher ratios on incarceration rates. The empirical model is illustrated in Figure 2. In the diagram, rectangles contain variables. One-directional arrows from one variable pointing to another indicate a plausible causal pathway in one direction, while two-directional arrows indicate a plausible causal pathway that runs both ways. Circles denote error terms of the equations.
Our SEM posits that both of our variables associated with school quality, test scores and student-teacher ratios, have direct effects on incarceration rates, as evidenced by the causal pathways. Moreover, we include ten plausible causal pathways based on the relevant literature, which connect test scores indirectly to incarceration mediated through variables closely associated with socioeconomic, economic, and demographic dimensions of a community. They include family stability, poverty, crime, social capital, income inequality, racial segregation, youth mortality risk, adult college education attainment, job outcomes, and homeownership. Nine of the ten pathways are bi-directional; hence, we account for whether these nine mediating factors may also have direct effects on test scores, and not just the other way around. Regarding student-teacher ratios, we include eleven plausible causal pathways connecting the ratios indirectly to incarceration rates, with ten of the eleven being the same as for test scores. The eleventh causal pathway is through test scores, since lower student-teacher ratios may improve test scores. To summarize, our tested network involves a set of 33 equations. The first equation, which is ultimately solved for, is for incarceration rates, which is a function of all 12 variables included in the network.
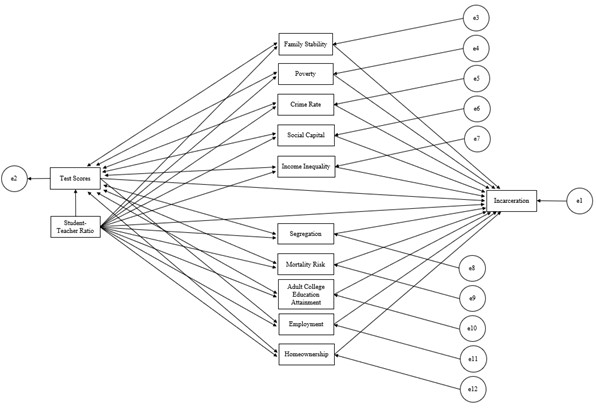
Figure 2: SEM Model
Regarding our first and second research questions, we hypothesize that higher test scores are directly negatively related to incarceration rates and that student-teacher ratios are directly positively related to incarceration rates. Hence, areas with higher average school test scores will tend to have lower incarceration rates. Moreover, areas with higher student-teacher ratios will tend to have higher incarceration rates. Regarding our third and fourth research questions, we hypothesize that both test scores and student-teacher ratios are indirectly related to incarceration rates through mediating factors, including family stability, poverty, crime, social capital, income inequality, segregation, youth mortality risk, adult college education attainment, job outcomes, and homeownership.
Data, Variables, and Sources
Outcome Variable
Incarceration rates, our outcome variable, are collected from the Opportunity Insights (OI) database and are associated with Chetty, Friedman, Hendren, Jones, and Porter (2018). Incarceration rates are defined as the share of children born between 1978 and 1983 who were incarcerated as of April 1st, 2010. Incarceration rates are measured at the census tract level.
Key Analysis Variables
We include two variables that are closely associated with school quality. The first variable is the standardized percentile of average third grade math test scores adjusted for parental income (referred to as test scores) and the second is the student-teacher ratio. Both are measured at the county levels and were collected from the OI database.
Pathway Variables Affected by School Quality
Family Stability
We include a family stability variable in our analysis because previous studies have shown a relationship between it and both education and incarceration. We follow Chetty et al. (2014) and measure family stability as the share of family households headed by a single parent, at the tract level. This variable was taken from the OI databases.
Poverty
We measure poverty as the share of residents living below the federal poverty line at the tract-level, which we posit is a mediating factor by which school quality effects incarceration rates. This variable was collected from the OI database.
Crime
We measure crime as the total crime rate per 100 thousand residents at the county level, which we posit is a mediating factor by which school quality affects incarceration rates. This variable was collected from the OI database.
Social Capital
We measure social capital at the county level following Chetty et al. (2018), who use Rupasingha and Goetz's (2008) social capital index. This variable was collected from the OI database.
Income Inequality
We measure income inequality at the county level using a Gini coefficient, following Chetty et al. (2014). Gini coefficients are a commonly used measure of inequality. This variable was collected from the OI database.
Segregation
Racial segregation at the county level is included in our analysis, measured with a Thiel Index. The Thiel Index is a commonly used measure of racial segregation. This variable is collected from the OI database.
Mortality Risk
We include a measure of mortality risk in our analysis, specifically the share of residents between 5 and 25 years old who died in year 2000. This variable was collected from the Institute for Health Metrics and Evaluation (IHME) database.
Adult College Education Attainment
We include a measure of adult college education attainment, which we measure as the share of residents, 25 years old and older, who have at least of bachelor's degree. This variable was collected from the OI database.
Employment
We include a measure of employment outcomes, which we measure as the unemployment rate at the census tract level. This is defined as the share of residents, 16 years old and older, who are in the labor force but are unemployed. This variable was collected from the OI database.
Homeownership
We include a measure of homeownership, which we measure as the share of housing units that are owner occupied at the county level. This variable was collected from the OI database.
The variables, their year measured, level of measurement, and source are summarized in Table 1.
Table 1. Variables Used in Analysis
| Variable | Definition | Year measured | Measurement level | Data source |
| Incarceration Rate | Fraction of US children born between 1978 and 1983 that were incarcerated on April 1st, 2010 | 2010 | Census Tract | OI |
| Test Scores | Mean grade 3-8 math test scores, adjusted for parent income | 2013 | County / District | OI |
| Student-Teacher Ratio | Ratio of students per every one teacher | 1997 | County / District | OI |
| Single Parents | Share (%) of family households that are single parent headed | 2000 | Census Tract | OI |
| Poverty Rate | Share (%) of residents living below the federal poverty line | 2000 | Census Tract | OI |
| Crime Rate | Total Crimes per 100,000 residents | 2000 | County | OI |
| Social Capital | Rupasingha and Goetz’s (2008) social capital index | 1990 | County | OI |
| Income Inequality | Gini Coefficient | 2000 | County | OI |
| Racial Segregation | Thiel Index | 2000 | County | OI |
| Mortality Risk | Share (%) of residents that died when they were between 5 and 25 years old | 2000 | County | IHME |
| College Educated Residents | Share (%) of residents, 25 years old and older, that have at least a bachelor’s degree | 2000 | Census Tract | OI |
| Unemployment Rate | Share (%) of residents, 16 years old and older, in the labor force that are unemployed | 2000 | Census Tract | OI |
| Homeownership Rate | Share (%) of housing units that are owner-occupied | 2000 | County | OI |
The analysis dataset includes 2,145 observations corresponding to 2,145 census tracts in NC. As of 2010, there are 2,195 total tracts in NC, so our analysis dataset contains around 98% of tracts in the state. The 50 tracts that were not included in the sample were dropped because they had missing values for some of the key variables in our analysis. Table 2 presents the descriptive statistics. The average incarceration rate across NC tracts is around 0.016. The mean test scores across NC counties, which are income adjusted and standardized, is around -2.27, while the mean student-teacher ratio is 16.2. Average share of family households that are single parent headed is 29.6. The mean crime rate is 0.010 and the average standardized social capital index value is – 0.65. The average measure of income inequality (Gini Coefficient) is 0.41 and the average racial segregation measure (Thiel Index) is 48.79. The mean mortality risk is 1.09. The mean share of residents that are college educated is 23.60 and the mean unemployment rate is 5.35. The mean homeownership rate is 69.3.
Table 2. Descriptive Statistics
| Variable | n | M | STD |
| Incarceration Rate | 2,145 | 0.01570 | 0.01567 |
| Test Scores | 2,145 | -2.26571 | 6.86958 |
| Student-Teacher Ratio | 2,145 | 16.22421 | 0.88962 |
| Single Parents | 2,145 | 29.58877 | 14.59594 |
| Poverty Rate | 2,145 | 12.1855 | 8.52764 |
| Crime Rate | 2,145 | 0.01037 | 0.00353 |
| Social Capital | 2,145 | -0.65453 | 0.89001 |
| Income Inequality | 2,145 | 0.41586 | 0.06427 |
| Segregation | 2,145 | 48.78681 | 14.01416 |
| Mortality Risk | 2,145 | 1.09238 | 0.23809 |
| College Educated Residents | 2,145 | 23.60255 | 17.16368 |
| Unemployment Rate | 2,145 | 5.34948 | 1.54776 |
| Homeownership Rate | 2,145 | 69.37118 | 7.16236 |
Results
We estimated our hypothesized model once, without any preceding iterations. The estimated direct effects are summarized in Table 3. The coefficients are standardized. Of the 36 direct effects, 17 are statistically significant. We focus here on the results for the education variables. The direct effect of test scores on incarceration rates is negative and significant at the 5% level. Hence, as the mean test scores in a county increase, incarceration rates in the underlying census tracts tend to fall. The direct effect of student-teacher ratios on incarceration rates is positive and significant at the 5% level. Hence, as the student-teacher ratios increase, incarceration rates tend to increase. Additionally, the direct effect of student-teacher ratios on test scores is insignificant.
The fit statistics for our estimated model are shown at the bottom of Table 3, and they suggest the model is a good fit. The Comparative Fit Index (CDI) is 1, suggesting that our model of incarceration rates explains nearly all the data’s variation. The Root Mean Square Error (RMSE) is practically 0, which also suggests that the model is a very good fit. The Akaike’s Information Criteria (AIC) and the Bayesian Information Criteria (BIC) are 73,569.31 and 73,591.99, respectively.
Table 3. Direct effects in the SEM for Incarceration Rates
| Output | Input | Estimate | SE ESTIMATE | p | |
| Incarceration Rate | <— | Test Scores | -0.00020** | 0.00009 | 0.025 |
| Incarceration Rate | <— | Student-Teacher Ratio | 0.00111** | 0.00049 | 0.023 |
| Incarceration Rate | <— | Single Parents | 0.00059*** | 0.00004 | < 0.001 |
| Incarceration Rate | <— | Poverty Rate | 0.00026*** | 0.00009 | 0.006 |
| Incarceration Rate | <— | Crime Rate | 0.02694 | 0.13295 | 0.839 |
| Incarceration Rate | <— | Social Capital | 0.00017 | 0.00054 | 0.755 |
| Incarceration Rate | <— | Income Inequality | -0.00328 | 0.00389 | 0.399 |
| Incarceration Rate | <— | Segregation | 0.00002 | 0.00005 | 0.648 |
| Incarceration Rate | <— | Mortality Risk | -0.01093*** | 0.00321 | 0.001 |
| Incarceration Rate | <— | College Educated Residents | -0.00016*** | 0.00003 | < 0.001 |
| Incarceration Rate | <— | Unemployment Rate | -0.00054* | 0.00031 | 0.083 |
| Incarceration Rate | <— | Homeownership Rate | 0.00007 | 0.00012 | 0.534 |
| Test Scores | <— | Student-Teacher Ratio | 0.79697 | 0.96311 | 0.408 |
| Test Scores | <— | Single Parents | -0.63429*** | 0.13435 | < 0.001 |
| Test Scores | <— | Poverty Rate | 1.14650*** | 0.29853 | < 0.001 |
| Test Scores | <— | Crime Rate | 24.94075 | 312.63120 | 0.936 |
| Test Scores | <— | Social Capital | -1.96531** | 0.98987 | 0.047 |
| Test Scores | <— | Income Inequality | -14.28292* | 7.66617 | 0.062 |
| Test Scores | <— | Segregation | -0.45031*** | 0.16867 | 0.008 |
| Test Scores | <— | Mortality Risk | -8.08965 | 11.71481 | 0.490 |
| Test Scores | <— | College Educated Residents | -0.00795 | 0.07341 | 0.914 |
| Test Scores | <— | Homeownership Rate | -0.43131 | 0.46075 | 0.349 |
| Single Parents | <— | Test Scores | 0.80266** | 0.34608 | 0.020 |
| Single Parents | <— | Student-Teacher Ratio | 0.31628 | 2.16197 | 0.884 |
| Poverty Rate | <— | Test Scores | -1.03947*** | 0.34988 | 0.003 |
| Poverty Rate | <— | Student-Teacher Ratio | -2.88190 | 1.95138 | 0.140 |
| Crime Rate | <— | Test Scores | -0.00026*** | 0.00007 | < 0.001 |
| Crime Rate | <— | Student-Teacher Ratio | 0.00021 | 0.00041 | 0.604 |
| College Educated Residents | <— | Test Scores | -0.14901 | 0.36213 | 0.681 |
| College Educated Residents | <— | Student-Teacher Ratio | 0.89251 | 1.96485 | 0.650 |
| Mortality Risk | <— | Test Scores | -0.02846 | 0.02805 | 0.170 |
| Unemployment Rate | <— | Test Scores | -0.05791** | 0.02937 | 0.049 |
| Unemployment Rate | <— | Student-Teacher Ratio | -0.14080 | 0.21029 | 0.503 |
| Homeownership Rate | <— | Test Scores | 0.53317* | 0.28966 | 0.066 |
| Homeownership Rate | <— | Student-Teacher Ratio | -0.67464 | 1.11739 | 0.546 |
| Social Capital | <— | Test Scores | 0.00775 | 0.02367 | 0.743 |
|
Notes . *** p ≤ 0.01; ** 0.01 < p ≤ 0.05; * 0.05 < p ≤ 0.10 RMSEA = 0 CFI = 1.00 AIC = 73,569.31 BIC = 73,591.99 |
|||||
Table 4 summarizes the estimated indirect effects of test scores and student-teacher ratios on incarceration rates. Regarding test scores, we tested 10 plausible causal pathways by which it indirectly effects incarceration rates, which are family stability, poverty, crime, adult college education attainment, mortality risk, employment outcomes, homeownership, and social capital. The overall indirect effect suggests that test scores are significantly and indirectly related to incarceration rates, and the direction of the relationship is positive.
Regarding student-teacher ratios, we tested 11 plausible causal pathways by which it indirectly effects incarceration rates, which are test scores, family stability, poverty, crime, adult college education attainment, employment outcomes, homeownership, and social capital. The overall total indirect effect suggests that student-teacher ratios are insignificantly indirectly related to incarceration rates, while the direction of the relationship is negative.
Table 4. Indirect Effects of Education Variables on Incarceration Rates
| Output | Input | Estimate | SE ESTIMATE | p | |
| Incarceration Rate | <— | Test Scores | 0.000230** | 0.000096 | 0.017 |
| Incarceration Rate | <— | Student-Teacher Ratios | -0.000318 | 0.000619 | 0.608 |
| Notes . * p < .05; ** p < .01; *** p < .001 | |||||
Table 5 summarizes the estimated total effects of test scores and student-teacher ratios on incarceration rates. Regarding test scores, the estimated total effect on incarceration rates is positive but highly insignificant. The same goes for student-teacher ratios.
Table 5. Total Effect of Education Variables on Incarceration Rates
| Output | Input | Estimate | SE ESTIMATE | p | |
| Incarceration Rate | <— | Test Scores | 0.000032 | 0.000073 | 0.658 |
| Incarceration Rate | <— | Student-Teacher Ratios | 0.000788 | 0.000801 | 0.325 |
| Notes . * p < .05; ** p < .01; *** p < .001 |
Briefly summarizing the results, our SEM estimation suggests that there is a significant relationship elementary education test scores and incarceration rates and student-teacher ratios and incarceration rates. The results also confirm our hypotheses. Higher test scores are associated with lower incarceration rates, while higher student-teacher ratios are associated with higher incarceration rates. Regarding the tested indirect effects of test scores on incarceration rates, the overall indirect effect is significant, with some of the indirect causal pathways driving the outcome. For instance, the specific pathways from test scores to incarceration rates through the factors of poverty, family stability, and employment outcomes are significant. Higher test scores are directly and negatively related to poverty rates, which are, in turn, directly and positively related to incarceration rates. Higher test scores are directly and negatively related to rates of single-parent households, which are, in turn, directly and positively related to incarceration rates. Higher test scores are directly and negatively related to unemployment rates, which are, in turn, directly and positively related to incarceration rates. Regarding the tested indirect effects of student-teacher ratios on incarceration rates, the overall indirect effect is insignificant and none of the specific indirect causal pathways are significant.
Discussion
Though incarceration rates have been declining over the last decade, incarceration remains an important and relevant issue in the U.S. The U.S. incarcerates more individuals than any other country in the world, even though it is not first in total population (Prison Policy, 2018; Prison Studies, n.d.). Estimates suggest that the U.S. incarceration system costs nearly $80 billion a year, and this does not include the significant social costs incarceration has on families, neighborhoods, and communities (Kearney et al., 2014). Hence, the causes and consequences of incarceration rates are topics worthy of continued investigation.
Our study focused on two factors that influence incarceration rates in a community, specifically elementary school test scores and student-teacher ratios, both of which are closely associated with school quality. Evidence suggests that children that receive a higher quality education have better outcomes, like higher lifetime earnings, lower crime rates, and lower incarcerations rates (Chetty et al., 2011; Card and Krueger, 1992; Giraldo et al., 2017; Lochner and Moretti, 2004). Many of the previous studies that have examined the relationship between education and incarceration have not been at a community level, nor have they accounted for the myriad of complex interactions that occur between a community's many characteristics. Our study contributes to the literature in that we examine the relationship at a community level, and we attempt to control for many of the interrelated relationships occurring between a community's characteristics. We do this by using census tract level data to approximate a community and we estimated an SEM of incarceration rates, which allows us to estimate possible indirect effects of test scores and student-teacher ratios on incarceration rates through intermittent factors like employment outcomes, crime, social capital, and so on. Our findings suggest that not only do these two variables directly affect local incarceration rates, but test scores indirectly affect incarceration rates through poverty rates, family structure, and unemployment rates. What this strongly suggests is that to better understand community-level incarceration rates, researchers need to consider the effectiveness of local school systems at educating local children. This is unsurprising, considering that long term outcomes are closely associated with early education and life experiences. This aligns well with the understanding that early experiences and environmental exposures are crucial for long-term outcomes (Hawkins, Kosterman, Catalano, Hill, and Abbott, 2005; Deming, 2009).
Our findings confirm our hypotheses that test scores and student-teacher ratios are related to local incarceration rates. Specifically, higher test scores in a local school system are directly associated with lower incarceration rates in the community and lower student-teacher ratios in the school system are associated with lower incarceration rates. These findings align well with other findings throughout the relevant literature (Giraldo et al., 2017; Lochner and Moretti, 2004; Arum and LaFree, 2008). Higher test scores proxy for greater student success in the classroom, meaning students are learning and performing well. In addition to the intellectual development, students are also likely growing in their self-confidence as a person and setting higher standards for their future, all of which are certainly relevant to long term outcomes (Baumeister et al., 2003; Muenks et al., 2018; Giraldo et al., 2017). School systems with more teachers per student may be better able to address individual learning needs and foster better relationships between teachers and students, since a teacher's attention is spread over a smaller pool of children (Glass, 1982; Blatchford, and Mortimore, 1994; Finn, 1998). Hence, this would certainly have beneficial long-term outcomes.
Regarding the indirect effects of test scores on incarceration rates, a significant mediating factor was poverty rates. We find that communities with higher elementary school test scores tend to have lower poverty rates, and communities with lower poverty rates tend to have lower incarceration rates. Children that attend higher quality schools tend to have better outcomes, like a decreased likelihood of falling into or being trapped in poverty (Chetty et al., 2014). Moreover, areas with higher quality schools tend to have higher rates of low-income children later escaping poverty as adults (Chetty et al., 2014). The relationship between poverty and incarceration is well documented, where communities with high poverty rates tend to have higher crime and incarceration for numerous reasons (Ludwig et al., 2001; Kelly, 2000; Kingston and Webster, 2015; DeFina, and Hannon, 2013). Hence, our finding aligns well with the previous literature, in that it suggests that elementary school test scores, a proxy for school quality, is negatively and indirectly related to incarceration through its negative relationship to poverty. By decreasing poverty rates in a community, higher quality education systems indirectly lower incarceration rates there.
An additional significant mediating factor between incarceration rates and elementary school test scores is family structure, measured as the rate of single-parent families. Previous studies find evidence of a relationship between family structure and outcomes like delinquency and incarceration. Studies show that children raised in single-parent households are more likely to commit crimes, be arrested, and become incarcerated, in addition to a myriad of other challenges, though the relationship is complex (Anderson, 2002; Schwartz, 2006; Antecol and Bedard, 2007). The direction from the elementary school test scores in a community to a community's level of family stability, however, is less clear. It could be that higher quality schools and education lead to fewer teenage pregnancies and risky sexual behaviors (Copping et al., 2013; Laflin et al., 2008). It could also be that early exposure to a high-quality education increases the likelihood of successful marriages, though this is speculative. Regardless, our finding is not without some precedent.
The last significant mediating factor is employment outcomes, measured as a community's unemployment rate. The relationship between community-level economic conditions and variables like crime and incarceration rates are well documented, though complex (Rosenfeld, and Fornango, 2007; Lauritsen et al., 2014; Raphael, Winter-Ebmer, 2001). Communities with higher unemployment rates may have higher incarceration rates for a myriad of reasons. Unemployed persons may be more likely to pursue illegal means of earning income out of a lack of other options, which will bring a high risk of being arrested and later incarcerated. Moreover, communities with high unemployment rates may be economically depressed, with few opportunities of advancement, leading residents out of desperation to behave in ways that bring them into contact with the prison system. A relationship between education quality and employment outcomes is well supported in the literature (Chetty, et al., 2011). Communities with higher quality school systems tend to have better employment outcomes among its residents, like higher employment rates and higher earned incomes. Students that receive better educations tend to perform better in marketplace once they become adults (Chetty, et al., 2011). Hence, our estimates suggest that, by lowering unemployment rates in a community, higher quality education systems may lower incarceration rates.
Limitations
There are limitations associated with our study. First, one possible limitation with our analysis plan is that we did not include variables in our SEM related to race and ethnicity. Undoubtedly, race and ethnicity are strongly related to both education-related and incarceration-related variables. Areas that are predominately non-white tend to have lower quality and underfunded schools, and the wide disparities in incarceration rates by race/ethnicity are well documented. We did not include race/ethnicity related variables in the SEM for a few important reasons. First, in the context of our SEM, including a race/ethnicity variable would have been very difficult to interpret. Moreover, race/ethnicity are so closely related to many of the other variables in the model that collinearity issues arise, making our parameter estimates highly volatile. For example, the share of the population in a tract that is non-white and the share of the population in a tract in poverty are extremely correlated in the U.S. Thus, the poverty variable in our SEM is likely capturing most of this relationship.
To keep our model's complexity in-check, we did not assert interrelatedness between socioeconomic, economic, and demographic characteristics because this would go beyond the scope of our study's particular interests. Nevertheless, incarceration rates undoubtedly have an impact on these dimensions of a community, too, as well as on elementary school characteristics. For our study, we were only interested in elementary school systems' impact on incarceration, and not the other way around, not because it is less important, but because incorporating these features into our model would have significantly reduced the interpretability of the results. Future research should further investigate how incarceration rates in a community impact the local elementary schools' characteristics, especially the ones associated with a school's effectiveness and quality like test scores and student-teacher ratios.
Conclusion
Incarceration is a highly relevant and important issue in the U.S., which incarcerates more people than any other country in the world. Evidence suggests that community-level incarceration rates are strongly related to local elementary school systems. Our study, which estimates a SEM of incarceration rates finds that variables associated with elementary school quality, specifically test scores and student-teacher ratios, directly and indirectly affect local rates of incarceration.
References
Anderson, A. L. (2002). Individual and contextual influences on delinquency: The role of the single-parent family. Journal of Criminal Justice, 30 (6), 575-587.
Antecol, H., & Bedard, K. (2007). Does single parenthood increase the probability of teenage promiscuity, substance use, and crime?. Journal of Population Economics, 20 (1), 55-71.
Arnold, R.D., & Wade, J.P. (2015). A definition of systems thinking: Systems approach. Retrieved from https://www.researchgate.net/publication/273894661 .
Arum, R., & LaFree, G. (2008). Educational attainment, teacher-student ratios, and the risk of adult incarceration among US birth cohorts since 1910. Sociology of Education , 81 (4), 397-421.
Arum, R., & Beattie, I. R. (1999). High school experience and the risk of adult incarceration. Criminology , 37 (3), 515-540.
Arvanites, T. M., & Asher, M. A. (1998). State and county incarceration rates: The direct and indirect effects of race and inequality. American Journal of Economics and Sociology, 57 (2), 207-222.
Baumeister, R. F., Campbell, J. D., Krueger, J. I., & Vohs, K. D. (2003). Does high self-esteem cause better performance, interpersonal success, happiness, or healthier lifestyles?. Psychological science in the public interest, 4 (1), 1-44.
Blatchford, P., & Mortimore, P. (1994). The issue of class size for young children in schools: what can we learn from research?. Oxford review of education, 20 (4), 411-428.
Card, D., & Krueger, A. B. (1992). Does school quality matter? Returns to education and the characteristics of public schools in the United States. Journal of Political Economy, 100 (1), 1–40.
Carson, E.A. (2020). Prisoners in 2019. Bureau of Justice Statistics. Retrieved from Prisoners in 2019 (ojp.gov) .
Chetty, R., Hendren, N., Kline, P., & Saez, E. (2014). Where is the land of opportunity? The geography of intergenerational mobility in the United States. The Quarterly Journal of Economics , 129 (4), 1553-1623.
Chetty, R., Friedman, J. N., Hilger, N., Saez, E., Schanzenbach, D. W., & Yagan, D. (2011). How does your kindergarten classroom affect your earnings? Evidence from Project STAR. The Quarterly journal of economics, 126 (4), 1593-1660.
Chetty, R., Hendren, N., & Katz, L. F. (2016). The effects of exposure to better neighborhoods on children: New evidence from the Moving to Opportunity experiment. American Economic Review, 106 (4), 855-902.
Chetty, R., Hendren, N., Lin, F., Majerovitz, J., & Scuderi, B. (2016). Childhood environment and gender gaps in adulthood. American Economic Review, 106 (5), 282-88.
Chiricos, T. G., & Bales, W. D. (1991). Unemployment and punishment: An empirical assessment. Criminology, 29 (4), 701-724.
Cohen, A. K., & Syme, S. L. (2013). Education: a missed opportunity for public health intervention. American journal of public health, 103 (6), 997-1001.
Copping, L. T., Campbell, A., & Muncer, S. (2013). Violence, teenage pregnancy, and life history. Human Nature, 24 (2), 137-157.
Daft, R. (2010). Management . 9 th ed. Mason, OH 45040, USA: South-Western Cengage Learning.
Dallaire, D. H. (2007). Incarcerated mothers and fathers: A comparison of risks for children and families. Family relations, 56 (5), 440-453.
Daza, S., Palloni, A., & Jones, J. (2020). The consequences of incarceration for mortality in the United States. Demography, 57 (2), 577-598.
DeFina, R., & Hannon, L. (2013). The impact of mass incarceration on poverty. Crime & Delinquency, 59 (4), 562-586.
Deming, D. (2009). Early childhood intervention and life-cycle skill development: Evidence from Head Start. American Economic Journal: Applied Economics, 1 (3), 111–134.
Figlio, D., Karbownik, K., Roth, J., & Wasserman, M. (2016). School quality and the gender gap in educational achievement. American Economic Review, 106 (5), 289-95.
Finn, J. D. (1998). Class size and students at risk: what is known? What is next?. National Institute on the Education of At-Risk Students, Office of Educational Research and Improvement, US Department of Education. Retrieved from https://files.eric.ed.gov/fulltext/ED418208.pdf .
Glass, G. V. (1982). School class size: Research and policy . SAGE Publications.
Glaeser, E. L., Laibson, D., Scheinkman, J. A., & Soutter, C. L. (1999). What is social capital? The determinants of trust and trustworthiness. Retrieved from https://www.nber.org/system/files/working_papers/w7216/w7216.pdf .
Glomm, G., & Ravikumar, B. (2003). Public education and income inequality. European Journal of Political Economy, 19 (2), 289-300.
Gibb, S. J., Fergusson, D. M., & Horwood, L. J. (2012). Childhood family income and life outcomes in adulthood: findings from a 30-year longitudinal study in New Zealand. Social science & medicine, 74 (12), 1979-1986.
Giraldo, A., Ojha, M., & Ojha, M. (2017). The effect of quality of education on violence: Evidence from Colombia. Vniversitas Económica, 17 (10).
Green, R. K., & White, M. J. (1997). Measuring the benefits of homeowning: Effects on children. Journal of Urban Economics, 41 (3), 441-461
Greenberg, D. F. (1977). The dynamics of oscillatory punishment processes. J. Crim. L. & Criminology, 68 , 643.
Grinstein-Weiss, M., Key, C., Guo, S., Yeo, Y. H., & Holub, K. (2013). Homeownership and wealth among low-and moderate-income households. Housing Policy Debate, 23 (2), 259-279.
Heckman, J. J. (2008). Schools, skills, and synapses. Economic inquiry, 46 (3), 289-324.
Hjalmarsson, R., Holmlund, H., & Lindquist, M. J. (2015). The effect of education on criminal convictions and incarceration: Causal evidence from micro‐data. The Economic Journal, 125 (587), 1290-1326.
Hanushek, E. A. (2003). The failure of input‐based schooling policies. The economic journal , 113 (485), F64-F98.
Hawes, D. P. (2017). Social capital, racial context, and incarcerations in the American states. State Politics & Policy Quarterly, 17 (4), 393-417.
Hawkins, J. D., Kosterman, R., Catalano, R. F., Hill, K. G., & Abbott, R. D. (2005). Promoting positive adult functioning through social development intervention in childhood: Long-term effects from the Seattle Social Development Project. Archives of Pediatrics & Adolescent Medicine, 159 (1), 25–31.
Hossein, E., Ramezanineghad, R., Yosefi, B., Sajjadi, S. N., & Malekakhlagh, E. (2011). Compressive review of organizational effectiveness in sport. Choregia: Sport Management International Journal , 7(1), 5-21.
Huebner, B. M., & Gustafson, R. (2007). The effect of maternal incarceration on adult offspring involvement in the criminal justice system. Journal of Criminal justice, 35 (3), 283-296.
Kearney, M. S., Harris, B. H., Jácome, E., & Parker, L. (2014). Ten economic facts about crime and incarceration in the United States. The Hamilton Project . Retrieved from https://www.brookings.edu/wp-content/uploads/2016/06/v8_thp_10crimefacts.pdf .
Kelly, M. (2000). Inequality and crime. Review of economics and Statistics, 82 (4), 530-539.
Kingston, S., & Webster, C. (2015). The most 'undeserving' of all? How poverty drives young men to victimization and crime. The Journal of Poverty and Social Justice, 23 (3), 215-227.
Laflin, M. T., Wang, J., & Barry, M. (2008). A longitudinal study of adolescent transition from virgin to nonvirgin status. Journal of Adolescent Health, 42 (3), 228-236.
Lauritsen, J. L., Rezey, M. L., & Heimer, K. (2014). Violence and economic conditions in the United States, 1973-2011: Gender, race, and ethnicity patterns in the National Crime Victimization Survey. Journal of Contemporary Criminal Justice, 30 (1), 7-28.
Lochner, L., & Moretti, E. (2004). The effect of education on crime: Evidence from prison inmates, arrests, and self-reports. American economic review, 94 (1), 155-189.
Logan, J. R., Minca, E., & Adar, S. (2012). The geography of inequality: Why separate means unequal in American public schools. Sociology of education, 85 (3), 287-301.
Ludwig, J., Duncan, G. J., & Hirschfield, P. (2001). Urban poverty and juvenile crime: Evidence from a randomized housing-mobility experiment. The Quarterly Journal of Economics, 116 (2), 655-679.
Marvell, T. B., & Moody, C. E. (1994). Prison population growth and crime reduction. Journal of Quantitative criminology, 10 (2), 109-140.
McGuire, W. J., & Sheehan, R. G. (1983). Relationships between crime rates and incarceration rates: Further analysis. Journal of Research in Crime and Delinquency, 20 (1), 73-85.
Muenks, K., Wigfield, A., & Eccles, J. S. (2018). I can do this! The development and calibration of children’s expectations for success and competence beliefs. Developmental Review, 48 , 24-39.
Muller, C. (2001). The role of caring in the teacher-student relationship for at-risk students. Sociological Inquiry, 71 (2), 241-255
Murray, J., & Farrington, D. P. (2008). Parental imprisonment: Long-lasting effects on boys' internalizing problems through the life course. Development and psychopathology, 20 (1), 273-290.
Owens, E. G. (2017). Testing the school‐to‐prison pipeline. Journal of Policy Analysis and Management, 36 (1), 11-37.
Owens, A., Reardon, S. F., & Jencks, C. (2016). Income segregation between schools and school districts. American Educational Research Journal, 53 (4), 1159–1197.
Owens, A., & Candipan, J. (2019). Spatial inequality of educational opportunity: A portrait of schools serving high- and low-income neighborhoods. Urban Studies, 56 (15), 3178–3197.
Pettus-Davis, C., Brown, D., Veeh, C., & Renn, T. (2016). The economic burden of incarceration in the US. Institute for Advancing Justice Research and Innovation. Washington University in St. Louis. Retrieved from https://static.prisonpolicy.org/scans/iajre/the_economic_burden_of_incarceration_in_the_us.pdf .
Raphael, S., & Winter-Ebmer, R. (2001). Identifying the effect of unemployment on crime. The Journal of Law and Economics, 44 (1), 259-283.
Ratcliffe, J. H. (2005). Detecting spatial movement of intra-region crime patterns over time. Journal of Quantitative Criminology, 21 (1), 103-123.
Ray, C. (2013). Department of Justice awards hiring grants for law enforcement and school safety. USDOJ press release. Retrieved from http://www.cops.usdoj.gov/Default.asp?Item=2695 .
Rohe, W. M., & Stewart, L. S. (1996). Homeownership and neighborhood stability. Housing Policy Debate, 7 (1), 37-81.
Rose, D. R., & Clear, T. R. (1998). Incarceration, social capital, and crime: Implications for social disorganization theory. Criminology, 36 (3), 441-480.
Rosenfeld, R., & Fornango, R. (2007). The impact of economic conditions on robbery and property crime: The role of consumer sentiment. Criminology, 45 (4), 735-769.
Sampson, R. J., and Groves, W.B. (1989). Community Structure and Crime: Testing Social Disorganization Theory. American Journal of Sociology, 94 , 774–802.
Schwartz, J. (2006). Effects of diverse forms of family structure on female and male homicide. Journal of Marriage and Family, 68 (5), 1291-1312.
Simes, J. T. (2018). Place and punishment: The spatial context of mass incarceration. Journal of Quantitative Criminology, 34 (2), 513-533.
Thomas, J. C., Torrone, E. A., & Browning, C. R. (2010). Neighborhood factors affecting rates of sexually transmitted diseases in Chicago. Journal of Urban Health, 87 (1), 102-112.
Trice, A. D., & Brewster, J. (2004). The effects of maternal incarceration on adolescent children. Journal of Police and Criminal Psychology, 19 (1), 27-35.
Von Bertalanffy, L. (1950). An outline of general system theory. British Journal for the Philosophy of Science.
Von Bertalanffy, L. (1972). The history and status of general systems theory. Academy of management journal, 15 (4), 407-426.
Wildeman, C. (2016). Incarceration and population health in wealthy democracies. Criminology, 54 (2), 360-382.